HiresLink Hiring Watch: U.S. Hiring Slows While LATAM Talent Costs Stay 50–70% Below U.S. Benchmarks
October 2026 hiring data: U.S. hiring slows while LATAM talent costs remain 50–70% lower. Explore salaries, talent supply, AI hiring and market trends.
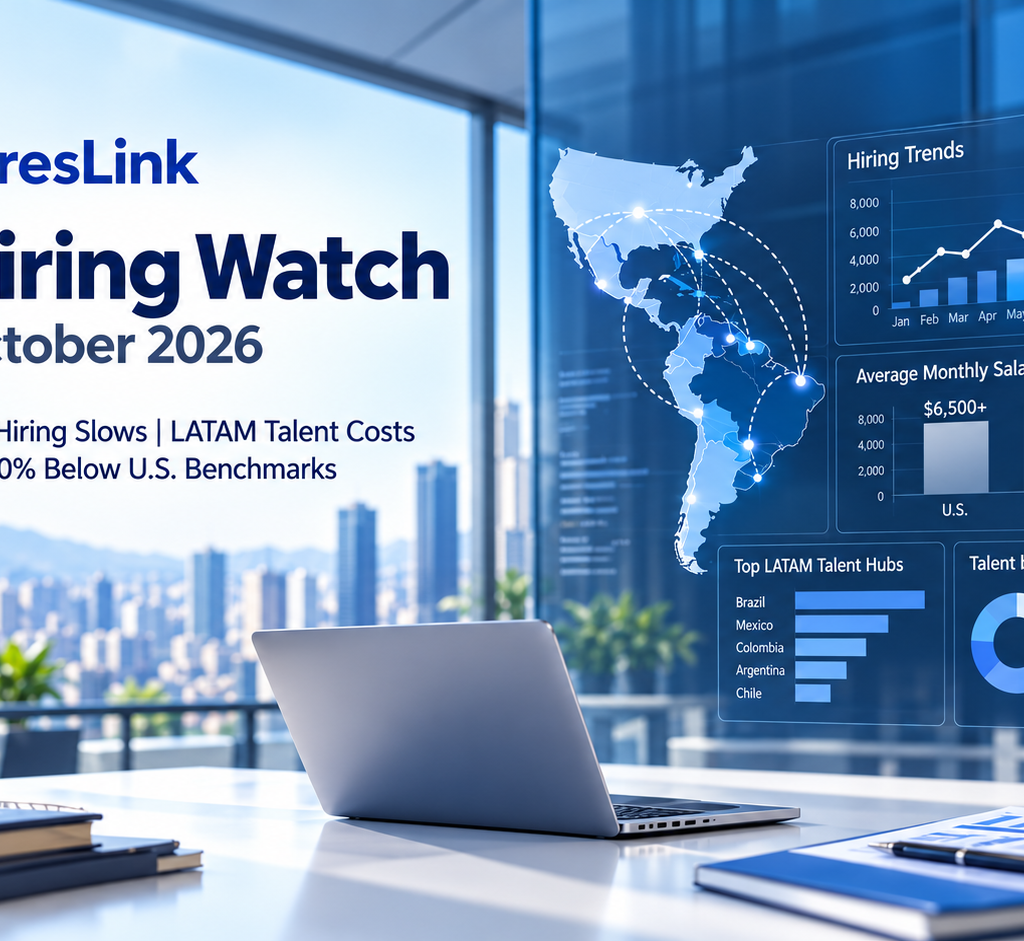
U.S. companies are entering Q4 with fewer open jobs, hiring still well below pre-pandemic levels, and recruiting processes that continue to take around 40 days to fill a role.
At the same time, the latest HiresLink LATAM Talent Intelligence Report shows a very different hiring equation for companies willing to search outside the U.S.: more than 90,000 pre-vetted professionals, salary data across 77+ roles, eight LATAM markets, and insights drawn from 280+ completed placements since 2019.
The biggest signal this month isn't simply that U.S. hiring is slowing.
It's that companies appear to be getting more selective while the cost, availability and depth of skilled talent vary significantly depending on what they are hiring for and where they look.
TL;DR
- U.S. job openings fell to 7.079 million in August.
- LinkedIn's hiring data shows U.S. hiring improved 1.9% month over month, but remains 6.5% below August 2025 and 25% below February 2020 levels.
- iCIMS reports an average 40-day time-to-fill, despite employers still seeing around 30 applicants per opening.
- Benefits account for approximately 30% of private-industry employer compensation in the U.S., making salary-to-salary comparisons incomplete.
- HiresLink currently tracks talent and salary data across 90,000+ LATAM candidates, 77+ roles and eight countries.
- Comparable LATAM talent can cost roughly 50–70% less than equivalent U.S. hiring, depending on role, country, seniority and hiring model.
- HiresLink's new YC Talent Map tracks 3,707 YC companies, with 719 showing observed LATAM talent.
- AI talent continues to command a premium, but supply varies dramatically by skill.
- Argentina, Brazil, Colombia, Mexico and other LATAM markets should not be treated as interchangeable hiring locations.
For companies planning headcount, the question is becoming less:
"Is LATAM cheaper?"
and more:
"Which LATAM market has the right talent, at the right salary, for this specific role?"
Hiring Watch: The Numbers We're Tracking
| Signal | Latest Data |
|---|---|
| U.S. job openings | 7.079 million |
| Change from July | -256,000 |
| LinkedIn U.S. hiring, MoM | +1.9% |
| LinkedIn U.S. hiring, YoY | -6.5% |
| LinkedIn hiring vs. Feb. 2020 | -25% |
| iCIMS openings, YoY | +13% |
| iCIMS hires, YoY | +2% |
| Average applicants per opening | 30 |
| Average time to fill | 40 days |
| U.S. private-industry compensation represented by benefits | 30% |
Sources: U.S. Bureau of Labor Statistics JOLTS, LinkedIn Economic Graph, iCIMS Insights and BLS Employer Costs for Employee Compensation.
U.S. Job Openings Fell Again in August
U.S. employers had 7.079 million open positions at the end of August, down from 7.335 million in July.
That is a decline of roughly 256,000 openings in a single month.
But falling vacancies don't automatically mean companies have stopped hiring.
LinkedIn's September Workforce Report shows that hiring actually increased 1.9% between July and August.
The longer-term picture is much weaker.
U.S. hiring remains:
- 6.5% below August 2025
- approximately 25% below its February 2020 pace
Technology, Information and Media was one of the stronger areas month over month, with LinkedIn recording an 8.1% increase in hiring from July to August.
The broader signal, however, remains cautious.
Companies are hiring.
They're just being much more selective about when and where they add headcount.
More Applicants Aren't Necessarily Producing Faster Hires
Another interesting signal comes from iCIMS.
Its September workforce analysis draws on data from more than 3.1 million users and 691 million candidate profiles.
Openings were 13% above the August 2025 baseline, while actual hires were only 2% higher.
At the same time:
- average applicants per opening fell to 30
- average time-to-fill reached 40 days
That creates an important distinction between two problems:
Candidate supply
and
candidate conversion.
A company may have 30 applicants and still struggle to hire.
Why?
Because applicants still have to move through:
- screening
- technical assessments
- hiring-manager reviews
- interviews
- approvals
- compensation negotiations
- offers
More candidate volume doesn't automatically make any of those stages faster.
This matters when companies look internationally for talent.
Opening a search across Latin America can dramatically expand the candidate pool.
But a larger talent pool won't fix a slow internal hiring process.
U.S. Salary Is Not the Same as U.S. Employer Cost
There's another issue with many international hiring comparisons.
They compare:
U.S. salary
with:
LATAM salary
and stop there.
That isn't an apples-to-apples comparison.
The U.S. Bureau of Labor Statistics reported that private-industry employer compensation averaged:
- $32.82/hour in wages and salaries
- $14.07/hour in benefits
- $46.89/hour in total employer compensation
in June 2026.
Benefits therefore represented approximately 30% of total private-industry compensation.
For full-time private-industry workers, average total compensation reached $54/hour.
That's why we recommend comparing fully loaded cost, not simply headline salary.
We break this distinction down further in our U.S. vs. LATAM nearshore hiring cost comparison.
What LATAM Talent Currently Costs
HiresLink publishes its salary data openly through the LATAM Salary Benchmarks database.
The broader September 2026 LATAM Talent Intelligence Report combines that compensation data with:
- candidate supply
- skills
- English proficiency
- country
- seniority
- placements
- time-to-hire
- retention
across more than 90,000 pre-vetted professionals.
Current benchmarks show substantial differences between LATAM compensation and equivalent U.S. roles.
Engineering Salary Benchmarks
| Role | LATAM Mid-Level | LATAM Senior | U.S. Senior Equivalent |
|---|---|---|---|
| Full-Stack Developer | $4,200/mo | $6,800/mo | $155K/yr |
| Backend Developer | $4,500/mo | $7,200/mo | $165K/yr |
| Frontend Developer | $4,000/mo | $6,500/mo | $150K/yr |
| DevOps / SRE | $5,200/mo | $8,200/mo | $180K/yr |
| Data Engineer | $5,000/mo | $8,000/mo | $175K/yr |
| Engineering Manager | $6,000/mo | $9,500/mo | $210K/yr |
Across HiresLink's current data, equivalent LATAM hiring can land roughly 50–70% below U.S. cost, depending on role, seniority, geography and employment structure.
For a broader view across engineering, sales, operations, finance and support, see our 2026 LATAM Salary Guide by Role and Seniority.
But cost is only one part of the hiring decision.
The more useful question is:
What does the right candidate for this specific role cost in the right LATAM market?
AI Talent Commands a Premium — But Supply Matters More
Specialized AI professionals continue to command higher compensation than general software engineering talent.
AI & Data Salary Benchmarks
| Role | LATAM Senior | U.S. Senior Equivalent | Approx. HiresLink Supply |
|---|---|---|---|
| ML Engineer | $8,500/mo | $200K/yr | ~2,400 |
| NLP Engineer | $8,800/mo | $210K/yr | ~900 |
| Computer Vision Engineer | $8,800/mo | $210K/yr | ~700 |
| MLOps Engineer | $8,200/mo | $195K/yr | ~600 |
| Data Scientist | $7,800/mo | $185K/yr | ~4,100 |
| LLM / RLHF Engineer | $9,200/mo | $220K/yr | ~350 |
| Prompt Engineer | $5,500/mo | $140K/yr | ~3,800 |
| AI Product Manager | $7,500/mo | $190K/yr | ~1,800 |
Specialized AI roles currently carry roughly a 15–25% premium over comparable general engineering positions in the HiresLink dataset.
But compensation isn't the most interesting difference.
Supply is.
HiresLink tracks around 4,100 data scientists, compared with only around 350 LLM/RLHF engineers.
The roles generating the most attention are often the ones with the shallowest candidate pools.
For companies that don't actually need an AI research profile, a more practical hire can be someone who combines technical capability with workflow knowledge.
For example, our AI Automation Specialist hiring data benchmarks LATAM specialists across tools such as n8n, Make, Zapier, APIs and OpenAI integrations.
What Companies Say They Want vs. What They Actually Hire
The title on the job description doesn't always match the person companies ultimately hire.
HiresLink compared the talent companies talked about hiring with the profiles that actually closed placements.
| What Companies Talk About Hiring | What Companies Actually Hired |
|---|---|
| "AI Agents" | Full-Stack Developer with LLM API experience — 22% of 2026 placements |
| "LLM Researcher" | ML Engineer integrating OpenAI/Anthropic — 14% |
| "Computer Vision PhD" | Python engineer with PyTorch — 4% |
| "Growth Hacker" | SDR + PPC Specialist split — 11% |
| "Fractional CTO" | Senior Backend Engineer + architecture ownership — 6% |
Source: HiresLink 2026 placement data.
HiresLink Takeaway
AI appears to be changing existing jobs faster than it is creating entirely new job categories.
Many employers don't necessarily need an exotic new job title.
They need an existing:
- engineer
- operator
- salesperson
- analyst
- marketer
who can apply AI effectively inside the function they already understand.
That's one of the signals we'll continue monitoring.
What 3,707 YC Startups Tell Us About Where Companies Build Teams
Salary data tells us what talent costs.
Workforce-location data can tell us where high-growth companies are actually choosing to build.
That's why we recently built the HiresLink YC Talent Map.
The dataset maps:
- 3,707 YC companies
- 215,949 indexed public professional profiles
- talent across 46 countries
- 21,585 indexed profiles in Latin America
Among the 3,159 YC companies for which workforce data was available, 719 already showed at least one team member in Latin America.
That's roughly 23%.
The adoption rate also changes dramatically with company size.
| YC Company Size | Companies | % With LATAM Talent |
|---|---|---|
| 1–10 | 2,256 | 8% |
| 11–50 | 794 | 29% |
| 51–200 | 335 | 50% |
| 201–1,000 | 120 | 54% |
| 1,000+ | 27 | 70% |
Source: HiresLink YC Talent Map, September 2026.
The pattern is notable:
The larger YC companies become, the more likely they are to have talent in Latin America.
The map also shows where those teams are concentrated.
LATAM Talent Across YC Companies
| Country | Indexed YC Profiles |
|---|---|
| Brazil | 6,284 |
| Mexico | 5,581 |
| Colombia | 4,851 |
| Argentina | 3,298 |
| Chile | 1,341 |
| Uruguay | 222 |
The map isn't verified payroll headcount. It uses indexed public professional profiles and should be interpreted directionally.
But it provides another useful signal alongside HiresLink salary and placement data:
LATAM hiring isn't theoretical. High-growth companies are already building teams across the region.
Explore all 3,707 companies on the YC Talent Map →
There Is No Single "LATAM Salary"
One of the mistakes we see most often is treating Latin America as one labor market.
It's not.
Candidate supply, compensation expectations, English proficiency and specialist skills vary substantially by country.
Mid-Level Engineering Benchmarks by Country
| Country | Approx. HiresLink Developer Pool | Mid-Level Salary | CEFR B2+ English | Strong Areas |
|---|---|---|---|---|
| Argentina | ~24,000 | 3,800–5,400/mo | 78% | Tech, AI, Design |
| Brazil | ~31,000 | 3,400–5,200/mo | 61% | Tech, Fintech |
| Colombia | ~14,000 | 3,200–4,800/mo | 74% | Tech, GTM, Healthcare |
| Mexico | ~11,000 | 3,800–5,600/mo | 72% | Healthcare, Finance, GTM |
| Chile | ~5,200 | 4,200–6,000/mo | 76% | Tech, FP&A |
| Uruguay | ~2,400 | 4,400–6,200/mo | 82% | Tech, AI |
| Peru | ~1,900 | 2,900–4,200/mo | 68% | Operations, Support |
| Costa Rica | ~1,600 | 4,000–5,800/mo | 84% | GTM, Healthcare |
Source: HiresLink LATAM Talent Intelligence Report — September 2026.
The lowest salary isn't automatically the best market.
Brazil, for example, offers the largest developer pool in the HiresLink dataset but also wider English-fluency variation.
Uruguay and Costa Rica have particularly strong English levels within our pool, but both offer smaller candidate populations and higher compensation bands.
Colombia currently combines competitive engineering costs with a 74% B2+ English rate, while Argentina provides one of the deepest senior technical benches.
Our complete guide to hiring in LATAM goes deeper into country, timezone, English and talent-pool differences.
The important point is that the hiring decision should increasingly be made:
Role × Country × Seniority × Skills
not simply:
U.S. vs. LATAM.
The Opportunity Isn't Limited to Developers
The HiresLink placement mix increasingly extends beyond core software engineering.
Current 2026 placements break down approximately as:
| Vertical | Share of Placements |
|---|---|
| SaaS / B2B Tech | 38% |
| Healthcare / RCM | 14% |
| Finance / Accounting | 11% |
| E-commerce | 9% |
| Legal | 7% |
| Construction / Architecture | 6% |
| Logistics | 5% |
That is reflected in compensation data too.
Healthcare Operations
| Role | LATAM Monthly | U.S. Equivalent | Approx. Difference |
|---|---|---|---|
| Medical Billing Specialist | $1,800 | $4,400 | 59% |
| Medical Scribe | $1,400 | $3,600 | 61% |
| Virtual Medical Receptionist | $1,200 | $3,200 | 63% |
| Revenue Cycle Analyst | $2,400 | $5,400 | 56% |
| Bilingual Care Coordinator | $1,600 | $4,000 | 60% |
For clinics and RCM companies, we've broken the comparison down further in our guide to the cost of hiring a LATAM Medical Billing Specialist.
Finance
Current mid-level benchmarks include:
- Bookkeeper: $1,800/month
- US-GAAP Accountant: $2,800/month
- FP&A Analyst: $3,400/month
- Controller: $4,500/month
- AR/AP Specialist: $1,500/month
Finance roles require particularly careful scope matching.
A LATAM Controller running accounting for a 30-person startup is not necessarily comparable to a U.S. Corporate Controller overseeing SEC reporting and multiple subsidiaries.
Our remote Controller cost analysis shows why normalizing the responsibilities of the role matters before comparing salary.
Hiring Model Matters Too: Contractor, EOR or Direct Hire?
Salary is only one component of the decision.
The same professional can have very different economics depending on how they are engaged.
Common structures include:
Independent Contractor
Often useful for defined projects, fractional work or shorter engagements.
Employer of Record
Useful when a company wants a long-term employee in a country where it doesn't have its own legal entity.
Direct International Hire
Can become more efficient for permanent hires or larger teams, but requires the employer to manage more of the employment infrastructure.
Staffing
Useful when the company wants recruiting, payroll, HR and replacement support handled within one engagement.
We've mapped those tradeoffs in our EOR vs. Contractor vs. Direct Hire guide.
The point isn't that one model is universally better.
It's that:
salary benchmark + country + employment structure
together determine the real cost.
Speed May Become as Important as Cost
The current U.S. hiring market presents an unusual combination.
There are still more than 7 million open jobs, while hiring remains well below its pre-pandemic pace.
At the same time, iCIMS is seeing an average 40-day time-to-fill.
Within HiresLink's own data:
- median shortlist delivery: 48 hours
- typical signed offer: 5–7 business days
- 72.6% of candidates test at CEFR B2 English or above
That does not mean every LATAM role should — or can — be filled in a week.
But it highlights a factor that often gets lost in cost comparisons.
The value of expanding the talent pool isn't only:
lower salary.
It can also mean:
faster access to a qualified candidate with the specific skills the company needs.
What We're Watching Going Into Q4
Four signals stand out.
1. U.S. Hiring Remains Cautious
U.S. vacancies fell again in August.
LinkedIn hiring remains 6.5% below last year and 25% below February 2020 levels.
Companies are still hiring, but they're doing it selectively.
That puts more pressure on each individual hire to create value.
2. Candidate Volume Isn't the Same as Hiring Efficiency
Thirty applicants per opening sounds like plenty.
A 40-day hiring cycle says something else.
Hiring teams need to distinguish between:
not enough candidates
and:
not moving qualified candidates through the process quickly enough.
Nearshore hiring only solves the first problem unless the recruiting process improves too.
3. AI Hiring Is Becoming a Skills Question
The shortage isn't simply:
"AI talent."
Demand is increasingly concentrated around combinations such as:
- LLM integration
- workflow automation
- MLOps
- Python
- data infrastructure
- API integration
- AI-enabled operations
Our own placement data suggests companies often end up hiring established functional talent with AI capability rather than entirely new job categories.
4. LATAM Is Becoming Multiple Hiring Markets, Not One
The salary, candidate supply and English profile in Colombia is different from Argentina.
Argentina differs from Brazil.
Brazil differs from Mexico.
And the best country for an engineering hire may not be the best country for:
- healthcare
- finance
- sales
- legal
- operations
The combination of our open salary benchmarks, Talent Intelligence Report and YC Talent Map is designed to make those differences easier to see.
HiresLink Hiring Watch
HiresLink Hiring Watch is our ongoing view of salaries, hiring demand, candidate supply and talent-market changes across the U.S. and Latin America.
Our current LATAM intelligence covers:
- 90,000+ pre-vetted candidates
- 77+ roles
- 8 LATAM countries
- 280+ completed placements
- salary benchmarks by role and seniority
- skills and talent-supply data
- country-level hiring intelligence
- English proficiency
- placement activity
- hiring speed
We also track where high-growth companies are already building distributed teams through the HiresLink YC Talent Map, covering 3,707 YC companies and more than 215,000 indexed professional profiles.
The goal is simple:
Turn real hiring activity into intelligence founders and Heads of Talent can actually use.
How to Cite This Data
When referencing proprietary figures from this report, please cite:
HiresLink. "HiresLink Hiring Watch: U.S. Hiring Slows While LATAM Talent Costs Stay 50–70% Below U.S. Benchmarks." October 2026.
For salary, supply and placement benchmarks:
HiresLink. "LATAM Talent Intelligence Report — September 2026 Edition." HiresLink Research.
For YC workforce-location data:
HiresLink. "YC Talent Map: Where 3,707 Y Combinator Startups Build Their Teams." September 2026.
Writers, researchers, journalists and HR teams are welcome to quote individual statistics and tables with attribution and a link to the corresponding HiresLink source.
Methodology
HiresLink salary benchmarks represent monthly gross USD compensation observed across the HiresLink talent network and hiring activity.
Where applicable, salary ranges represent the 25th–75th percentile of observed compensation rather than isolated minimum or maximum values.
Current salary observations cover hiring activity between January 2024 and May 2026.
Unless specifically stated otherwise, salary benchmarks exclude:
- HiresLink recruiting fees
- equity
- bonuses
- separate EOR costs
Candidate supply reflects HiresLink's active pre-vetted talent pool.
English proficiency is assessed through live conversation against CEFR standards rather than being based solely on self-reporting.
Placement figures reflect HiresLink placement activity.
YC Talent Map figures are based on the public Y Combinator company universe and indexed public professional profiles associated with current company roles. These counts are directional workforce indicators and should not be treated as verified payroll headcount.
External U.S. labor-market data referenced in this edition comes from:
- U.S. Bureau of Labor Statistics — Job Openings and Labor Turnover Survey
- U.S. Bureau of Labor Statistics — Employer Costs for Employee Compensation
- LinkedIn Economic Graph — September 2026 Workforce Report
- iCIMS Insights — September 2026 Workforce Report
External data provides wider labor-market context. HiresLink does not claim ownership of those datasets.
Explore the Data
Planning a LATAM hire?
Explore LATAM Salary Benchmarks →
About HiresLink Team
Expert insights from the HiresLink team on hiring LATAM tech talent, remote work, and building distributed teams.
Table of Contents
Ready to Hire Top LATAM Talent?
Get matched with pre-vetted developers, designers, and specialists in 5 business days.